Data Analytics using Excel
Data Analytics using Excel Free Course
Enroll in this free course to practice Data Analytics using Excel. Understand several phases of a Data Analytics project, Data Cleaning, and different Excel functions that support employing data to work with different tasks.
What you learn in Data Analytics using Excel ?
About this Free Certificate Course
Learn to perform Data Analytics using excel in this course. This free course has been designed to prepare you for meaningful opportunities in the future pertinent to Data Analytics. The course starts with the Introduction to Data Analytics and explains the phases of the Data Analytics project. It will further guide you to use different functions of excel with regard to Data Analytics like Sort and Filter, Lookup functions, conditional formatting, Pivot tables, and more. The final phase of this course will cover Data Visualization, in which you will be able to learn how to represent data using pictorial charts and tables. Using various examples, the instructor explains Data Visualization in the course. Attend a quiz after completing the course that lets you test your knowledge and claim your course certificate once you pass it.
Launch your Data Analytics career by extending your knowledge with the best Data Analytics Courses. Learn the foundations and advanced concepts to secure a job in the industry.
Course Outline
Moving further in this Data Analytics using Excel course, you will learn about Data Cleaning, the first phase of Data Analytics. The instructor will explain the process with the help of examples to make it easier for you to grasp. Also, know why Data Cleaning is important for the business.
This module will introduce you to Data Analytics, which is nowadays everywhere. It is becoming increasingly important to analyze the data in different industries, which is why it is great for you to learn Data Analytics and how we can do it using excel. This module will only introduce you to the importance of learning Data Analytics.
This module will be focused on the journey of processing raw data into meaningful data. This process is divided into various phases of Data Analytics: Data cleaning, Data Analysis, and Data Visualization. Understand each phase in detail and learn how you can take critical decisions using data in a business.
Let's just move into Data Validation in this module. It is a very interesting tool that lets you control certain values in the spreadsheet. Here you will learn how to manage data using Data Validation.
Pivot tables are used to sort, count, total or reorganize the data stored in a table. Pivot tables are one of the most powerful features in Excel for Data Analytics. In this module, understand what Pivot tables are used for and how they are used by looking into examples shared by the instructor.
Our course instructor

Mr. Gaelim Holland
Senior Data Scientist
With this course, you get
Free lifetime access
Learn anytime, anywhere
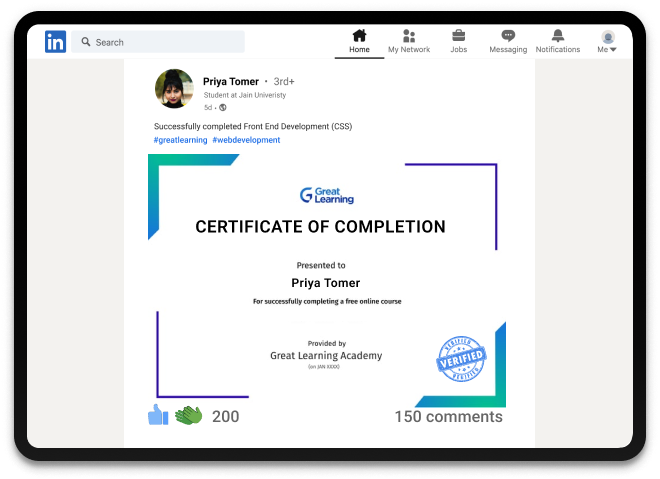
Completion Certificate
Stand out to your professional network
1.5 Hours
of self-paced video lectures
Frequently Asked Questions
Will I get a certificate after completing this Data Analytics Using Excel free course?
Yes, you will get a certificate of completion for Data Analytics Using Excel after completing all the modules and cracking the assessment. The assessment tests your knowledge of the subject and badges your skills.
How much does this Introduction to Data Analytics using Excel course cost?
It is an entirely free course from Great Learning Academy. Anyone interested in learning the basics of Excel Data Analytics can get started with this course.
Is there any limit on how many times I can take this free course?
Can I sign up for multiple courses from Great Learning Academy at the same time?
Yes, you can enroll in as many courses as you want from Great Learning Academy. There is no limit to the number of courses you can enroll in at once, but since the courses offered by Great Learning Academy are free, we suggest you learn one by one to get the best out of the subject.
Why choose Great Learning Academy for this free Data Analytics using Excel course?
Great Learning Academy provides this Data Analytics using Excel course for free online. The course is self-paced and helps you understand various topics that fall under the subject with solved problems and demonstrated examples. The course is carefully designed, keeping in mind to cater to both beginners and professionals, and is delivered by subject experts.
Great Learning is a global ed-tech platform dedicated to developing competent professionals. Great Learning Academy is an initiative by Great Learning that offers in-demand free online courses to help people advance in their jobs. More than 5 million learners from 140 countries have benefited from Great Learning Academy's free online courses with certificates. It is a one-stop place for all of a learner's goals.
Success stories
Can Great Learning Academy courses help your career? Our learners tell us how.And thousands more such success stories..


.jpg)


